A recipe recommendation system
You arrive home and turn on Netflix. On the front page: hundreds of shows. They're not ordered randomly. Netflix has been perfecting the science of recommending shows for years now. Google has perfected the science of sorting search results.
To this day, no one knows exactly how Google sorts their search results. Recommendation systems are gold, and a big part of the success of big tech.
Yeah, this article is not about food. It's about recommender systems.
While building one, my assumption that Scandinavian food was not for me, was debunked. Turns out, it's one of my favourites (at least according to what I built). Hard to believe?
On cooking
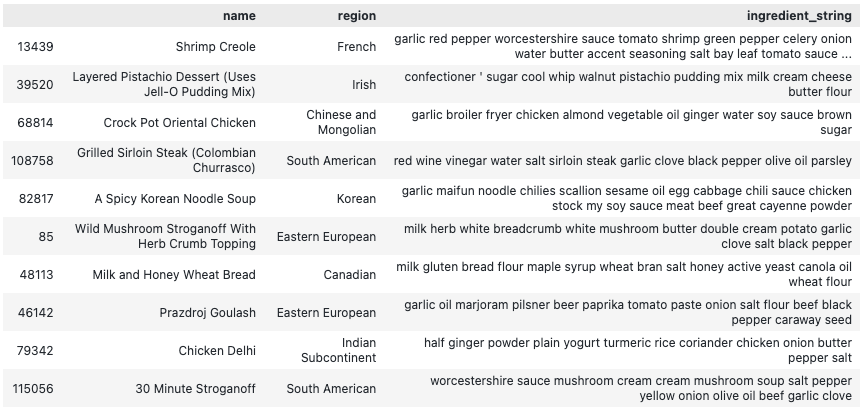
I'm not a fan of the culinary arts (the opposite really). But I decided to build a dataset of recipes. 160.000 recipes. Each one has a name, a region, a link, and ingredients. I scraped them from RecipeDB. RecipeDB scrapped them from somewhere else - the data is ok-ish quality.
Here's a sample:
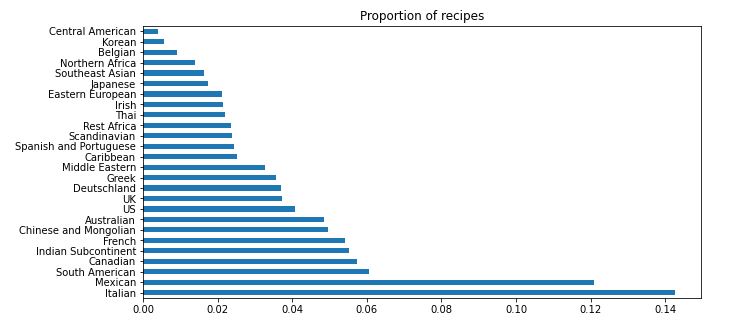
And here's there distribution of recipes across regions:
Vectors are dope, more of those
Data is messy. Images, text, audio... They come in thousands of formats. But there's a common language to every data type: vectors (or arrays, whatever).
In machine learning, vectors that represent data are referred to as embeddings. Transforming a word or a sentence in to an embedding it straightforward nowadays:
from flair.embeddings import WordEmbeddings
from flair.data import Sentence

# create embedder Glove in this case

glove_embedding = WordEmbeddings('glove')

# create a sentemce

sentence = Sentence('pineapple pizza')

# embed a sentence

glove_embedding.embed(sentence)

# you can get the embedding for the whole sentence

sentence_embedding = sentence.embedding

# or check the embedding for each word (e.g., token)

for token in sentence:
    print(token)
    print(token.embedding)

# prints...

# Token[0]: "pineapple"

# tensor([-1.3641,  0.2901, ...])

# Token[0]: "pineapple"

# tensor([-1.3641,  0.2901, ...])
Getting the vector for a sentence, is done by averaging the vectors of the words inside of it. We could use also BERT to generate embeddings for sentences.
There's one big advantage of these pertained models like BERT: the embeddings preserve the semantic meaning of the words. So, in theory, two sentences with similar meanings, should have similar vectors.
These fancy embeddings take time to compute. In the interest of time, I went with Glove to calculate them.
A galaxy of recipes
Let's leverage the technique above to embed all the recipes in our dataset. We take the ingredient_string of each recipe, and use Glove to generate a matrix of embeddings:
# create embeddings for all of them

sentence_list = [Sentence(text) for text in df.ingredient_string]
document_embeddings.embed(sentences=sentence_list)
embedding_matrix = numpy.array([s.embedding.numpy() for s in sentence_list])
print(embedding_matrix.shape) # prints (115657, 100)
That's a pretty large matrix. 115657 vectors, with 100 dimensions each one. Now, we can visualise 3 dimensions - but not 100.
To visualise them, we need to reduce the dimensionality of these vectors. UMAP does just that:
# let's use UMAP to help us visualize these vectors

# you could use t-SNE, PCA, etc.

umap_fit = umap.UMAP()
umap_matrix = umap_fit.fit_transform(embedding_matrix)
print(umap_matrix.shape) # (115657, 2)
Alright, now we have a 2D matrix of our 116.000 recipes. That's visualisable. For the sake of your browser, here's a random set of 2000 recipes in 2D space:
Remember, the closer two recipes are, the more similar they should be. It looks like it. Notice how recipes from the same region tend to form groups. This makes sense: recipes of the same region use similar sets of ingredients.
I don't like spinach
While studying recommendation systems. I came across a particularly interesting technique for building recommender systems.
The first step is to create a network of items (recipes in our case). This includes the recipes that you like, and recipes that you don't like. Using pandas, let's define that:
# let's define some polarising ingredients

liked_ingredients = ["cheese", "pizza", "avocado", "olive oil"]
hated_ingredients = ["spinach", "mushroom", "olive", "beef", "truffle", "blue cheese"]

# let's add a "like" property

df["like"] = 0

# and populate our data

df.loc[df.ingredient_string.str.lower().str.contains("|".join(hated_ingredients)), "like"] = -1
df.loc[df.ingredient_string.str.lower().str.contains("|".join(liked_ingredients)), "like"] = +1
Yeah, I don't like spinach. Let me be.
Once I've defined what recipes I like, and what recipes I don't, we can use our leverage our embeddings again, to visualise my own network of recipes. Here's a sample of 500:
Scandinavia, who would've thought
The second step is to score each "unseen" item (e.g., recipes that I don't know if I will like or not). To do so - we need to look at its neighbours. Remember, we're talking about vectors, so neighbours in this context means similar vectors. Let's take the cosine similarity of two vectors as the measure of their similarity.
The process to score an "unseen" recipe is then:
1. Identify its K (e.g., 10) closest neighbours
2. Calculate the average score of the neighbours (e.g., +1 if we like, -1 if we don't)
3. If we want to get fancy, we can weight that average with the distance to the unseen item
If you're the visual kind:
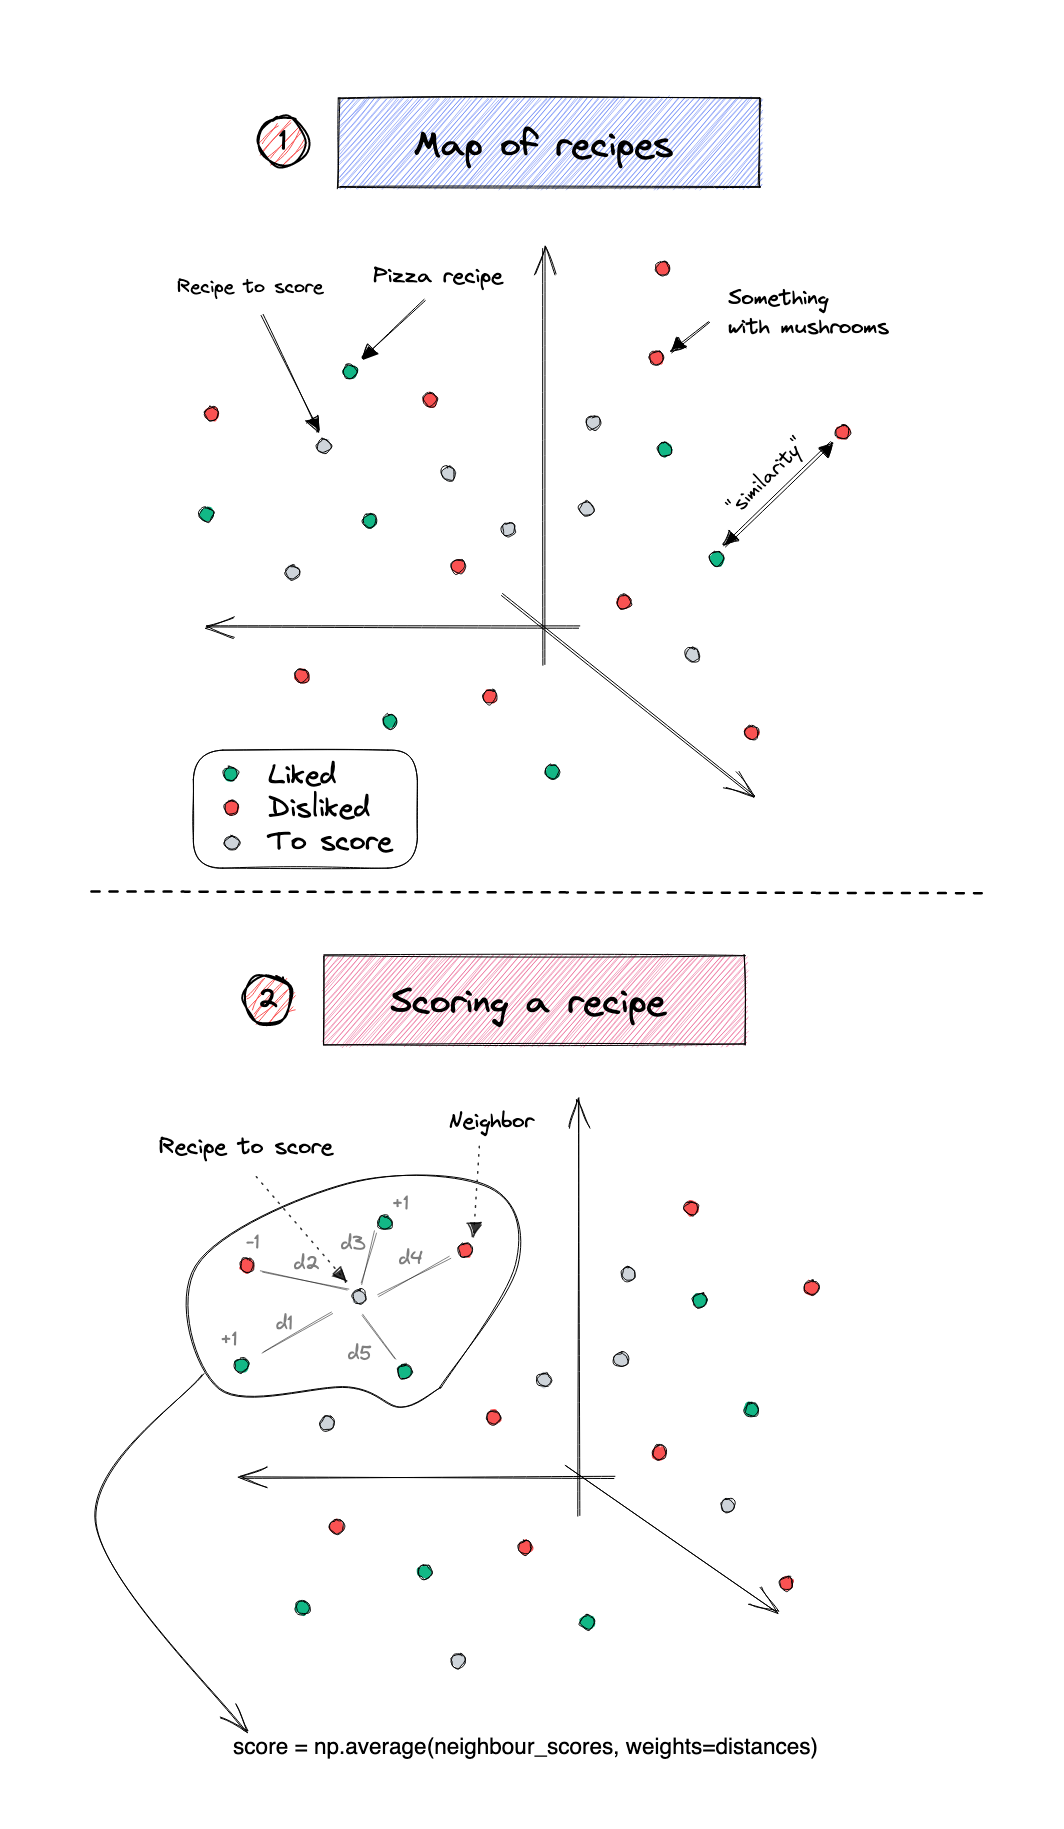
With the above methodology, we can score every single "unseen" recipe. We scored every liked and disliked recipe as a -1 or a +1. Therefore, every unlabelled recipe will have a score between these two numbers. If that score is above 0, I am more likely to like the recipe, if not, I'm more likely to dislike it.
But wait. This sounds computationally expensive.
# count the likes and dislikes

df.like.value_counts(normalize=False)

# 0    54905

# 1    48661

#-1    12091
This means that for each one of the 55.000 unseen recipes, we need to calculate the distance to each one of the 60.752 seen recipes. And only then determine which are the K closest neighbours. Yeah that could take a long time.
Quick maths - literally
Fortunately - Facebook's AI team has tackled this challenge. Not only that, they've shared it as an open-source package. Faiss, is an open -source library that does exactly what we need. It finds the most similar K vectors to the one(s) you're searching for.
We're not talking about 116.000 recipes anymore. That will take less than 2 seconds on my machine:
# start by taking the labeled and unlabelled embeddings

labeled_embeddings = embedding_matrix[labeled_indices, :]
unlabeled_embeddings = embedding_matrix[unlabeled_indices, :]

# create our index

d = labeled_embeddings.shape[1]
index = faiss.IndexFlatIP(d)

# normalize and add our labeled recipes

faiss.normalize_L2(labeled_embeddings)
index.add(labeled_embeddings)

# normalize and query for our unlabelled recipes

faiss.normalize_L2(unlabeled_embeddings)
r_distances, r_indexes = index.search(unlabeled_embeddings, k=6)
On larger datasets (we're talking 1M+ vectors) the exact neighbour search can be very computationally expensive.
With FAISS, we able to speed that up. We can do approximate searches to save time, we can make these calculations on GPUs. It's an awesome tool, with a great wiki.
Icelandic Caramel Potatoes
Yup - back to food.
After some data wrangling, I was able to give a weighted recommendation to every recipe in the network:
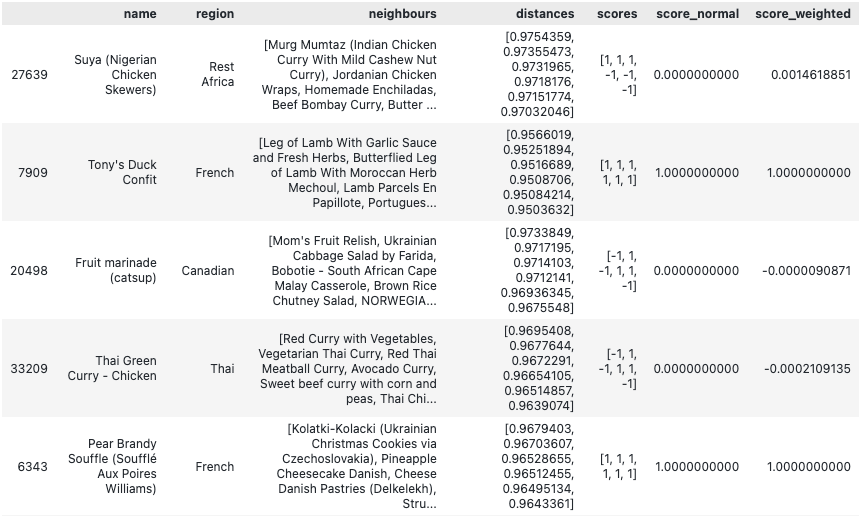
distances: the distances that each one of the 10 neighbours has to the recipe in the rowscores: the scores of the 10 closest neighbours to the recipe (+1 if I like, -1 if I dislike)score_normal: The average score of the 10 neighboursscore_weighted:score_normal, weighted bydistance
As you can see above - I don't think I would like that Suya recipe. But both French recipes on the table have perfect 1.0 scores - I should like them. In principle of course. Pear Brandy Souffle looks like a party I wouldn't like to get into - but hey, you only know if you try it.
There's another interesting question we can explore: What's my most recommended region? What is the region that suits my tastes the most? Pandas to the rescue:
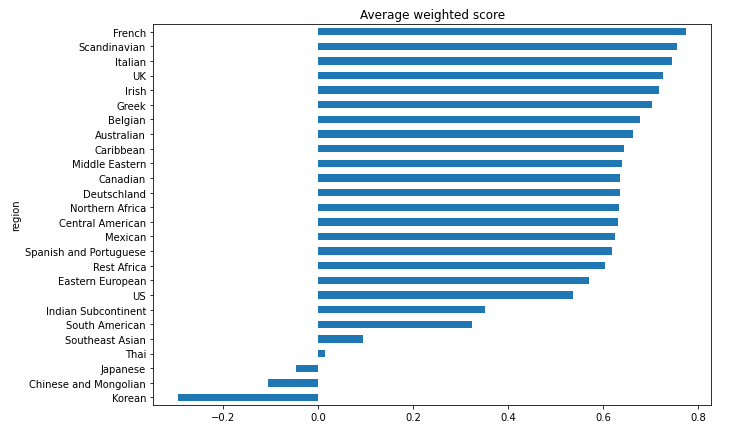
Looks like French cuisine has the highest average recipe score. But Scandinavia is a close second! Who would've thought that? Maybe I do belong in Scandinavia.
The return of simple tools
Transparency is one of the biggest advantages of this method. By looking at the closest neighbours column - we are able to know how a certain recommendation was made. With so many ML algorithms and transformers out there - interpretability is not an easy thing to land.
Machine learning has made incredible advancements in the last 3/5 years. We have transformers, deep architectures, massive multi-billion parameter models serving users. Amidst all the advancements it's easy to get lost in adopting always the new shiny thing. Even if we don't understand how that shiny thing works.
There's a certain beauty to simple tools. Simple, explainable, and interpretable algorithms are a joy. And if simple is good - why complicate?