Monitoring Machine Learning APIs
Last Friday I presented at PyData Global. I talked about monitoring, but felt like there was more I should've said. So this article is just about that.
Even though the number of models in the wild is growing, the field of monitoring is still green and full of unknowns.
Almost all models I've put into customers' hands have had some sort of monitoring. In my head, I've divided ML monitoring in three main areas.
Let's explore them.
Logs & Error monitoring
This first area is responsible for monitoring three things:
- Errors: Something in the application blew up, and needs to be checked (e.g., trace backs, etc.)
- Logs: What's going on? When is it going on?
- Performance: How fast is the API? How much load can it take?
This is very similar to traditional software observability. And yes, most machine learning applications - are, in fact, software applications. This means we have all the concerns of traditional software, and then some.
When it comes to logging, loguru has made life easier. At the end of the day, who likes to configure loggers?
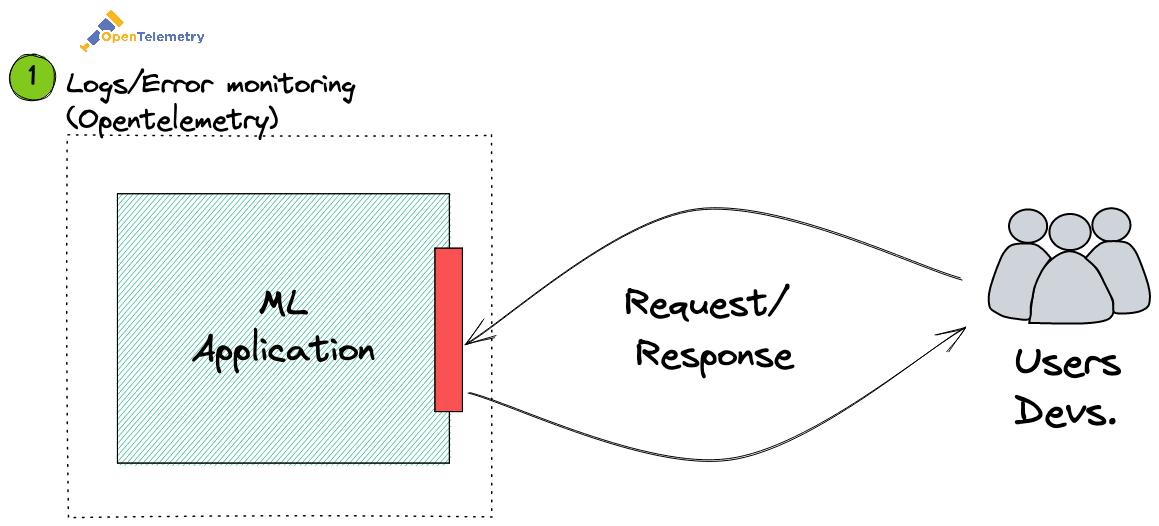
Another less known component is OpenTelemetry. OpenTelemetry has slowly become the standard in observability. Think of it as a wrapper that allows you to capture useful statistics on the performance of your app. It also allows you to capture some custom events/data that are useful for debugging.
Here's an example:
import fastapi
from opentelemetry import trace
from opentelemetry.exporter.otlp.proto.http.trace_exporter import (
    OTLPSpanExporter,
)
from opentelemetry.instrumentation.fastapi import FastAPIInstrumentor
from opentelemetry.sdk.trace import TracerProvider
from opentelemetry.sdk.trace.export import BatchSpanProcessor

from .models import Result, Item

# set up tracing and open telemetry

provider = TracerProvider()
processor = BatchSpanProcessor(OTLPSpanExporter())
provider.add_span_processor(processor)
trace.set_tracer_provider(provider)
tracer = trace.get_tracer(__name__)

# instrument FastAPI

app = fastapi.FastAPI(title="demo")
FastAPIInstrumentor.instrument_app(app)

@app.post("/predict/", reponse_model=Result)
def predict(features: Item):
    # get the current span
    current_span = trace.get_current_span()

    # hash input
    input_hash = hash(features)

    # save hash to opentelemetry
    current_span.set_attribute("app.demo.input_hash", features_hash) # <- Saves attribute

    # return predictions
    prediction = get_prediction_for(features)
    return prediction
Let's walk through the example:
- We kick off manual instrumentation using the
TracerProvider(docs) - We add automatic instrumentation with the FastAPIInstrumentator (docs)
- We have the ability to send custom events with the
current_span.set_attributefunction (docs)
If you're using something like DataDog, Honeycomb, or any other provider that supports OpenTelemetry - you should get all this information on your service's dashboard. You'll get all the stats related to your application, and all the custom events you are sending in as well.
This is particularly interesting to understand, for example, when your API is breaking, and what is making it break!
Drift/Degradation monitoring
The second area of monitoring is about model degradation in the face of new data. This usually happens as models in production start being outdated. Trying to make predictions on types of data your model has never seen before, usually leads to problems. This concept is known as data drift.
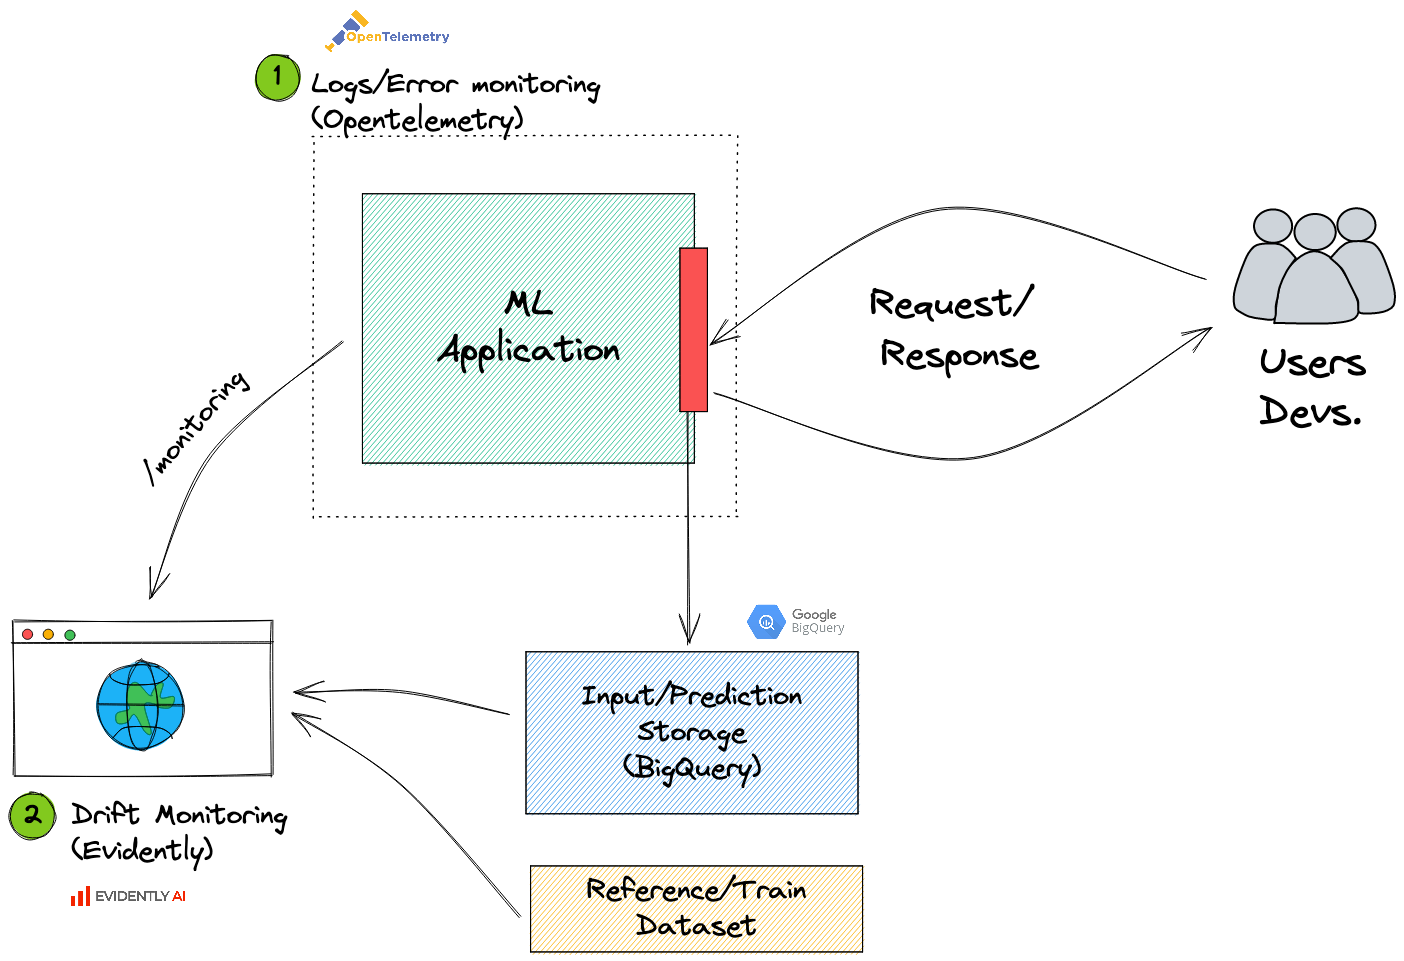
In a previous article, I talked extensively about this topic. I explained how to leverage FastAPI and Evidently to monitor drift, in real-time, for your ml application. So go read that if you're interested.
There is, however, one concept I should double down on. The fact of storing all inputs (e.g., requests) and outputs (e.g., predictions) of your model. Here's an example of doing so - without increasing response latency:
# ...

@app.post("/predict/", reponse_model=Result)
def predict(features: Item, background_tasks: fastapi.BackgroundTasks,):
    prediction = get_prediction_for(features)

    # saves both inputs and outputs as json to our predictions database
    # runs in the background - doesn't make anyone wait
    background_tasks.add_task(
        save_to_database,
        input=features.dict(),
        output=asdict(prediction),
        created_at=datetime.datetime.now()
    )
    return prediction

# ...
This prediction sink (red in the image above), is key. As described in the previous article, it allows you to monitor drift. But it also allows you to get insights into the third area of monitoring. Let's talk about that one.
Business monitoring/reporting
The third and final area of monitoring relates to everything else you might want to keep track of. Your team might want to know how many predictions the API has made in the past month, or how many times you've predicted a certain class. Maybe you, or some other team, is tracking KPIs that are highly related to your model. Maybe the finance dept. wants to know the new CTR based on your recommendations.
The answers to these questions often come in the form of a dashboard.
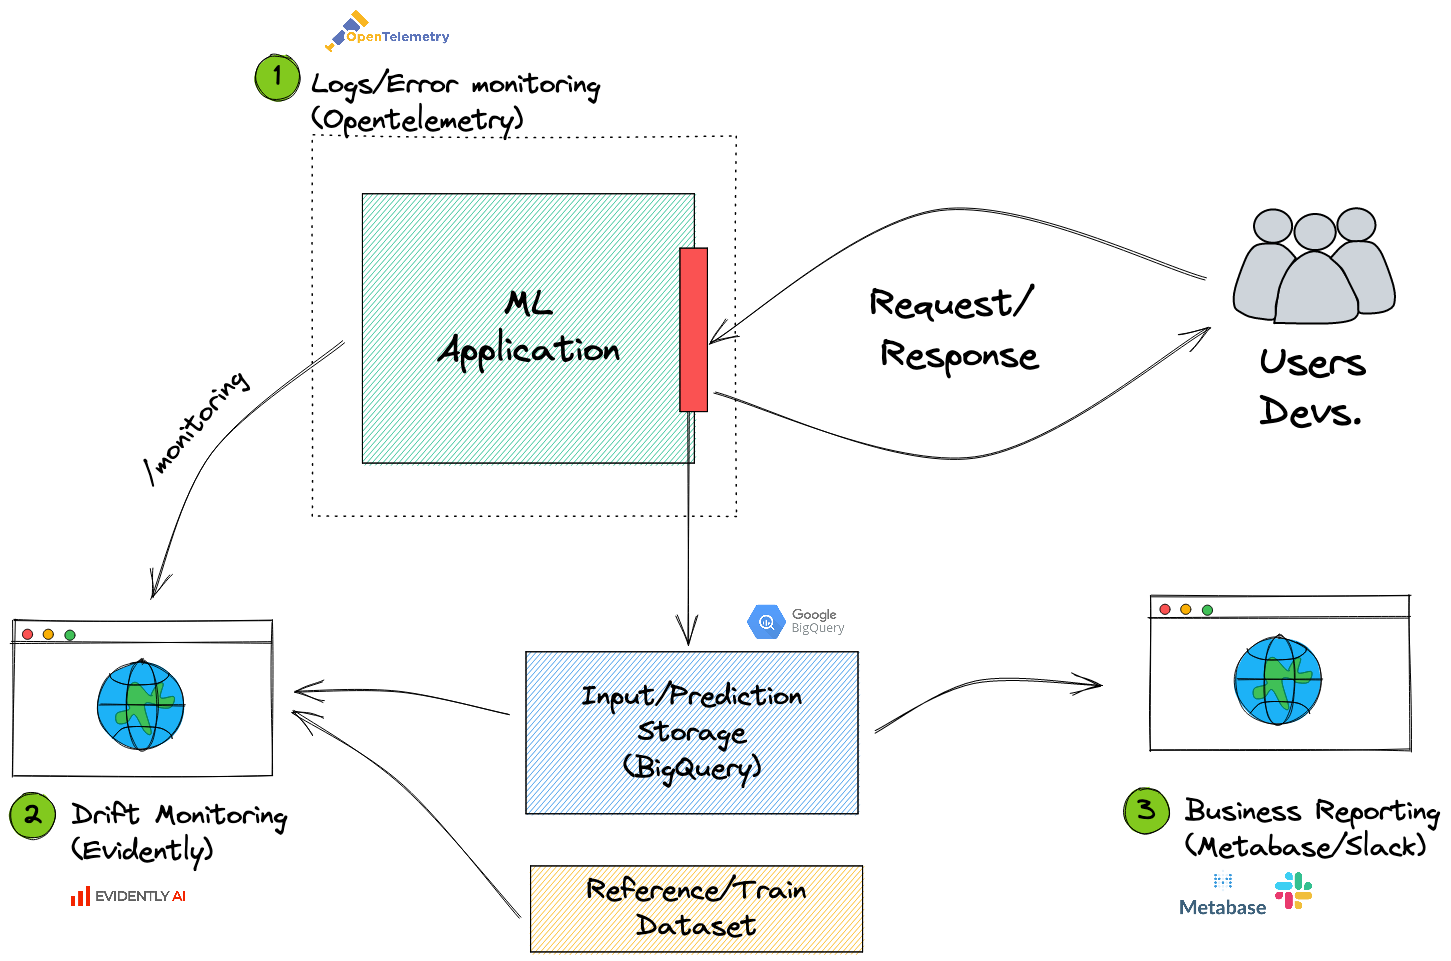
Fortunately, if we store our inputs and predictions in a flexible enough format (e.g., json), we'll be able to take almost any off-the-shelf tool and make a dashboard. Designing Metabase dashboard from your historical json predictions stored in BigQuery should be straightforward. You could also stick to Google Data Studio. Or use Excel. You get my point, you can use whatever. json is flexible enough to be sorted by created_at and pushed into a dashboard.
Although often overlooked, this third level of reporting will often debunk the whole "your model is a black box" paradigm. It allows other stakeholders to know exactly what is going on in your model.
Closing thoughts
Yes. Adding all of these different types of monitoring requires some boilerplate code. And of course, setting this up might take some time. Especially if you do these to every model in production.
However, it's certainly impressive just how much insight you can get from some OpenTelemetry auto-instrumentation and a background job to save all your predictions.
Sufficiently monitoring your ML model increases your team's confidence when putting models out there. It's a bit like testing - you are now more sure things are happening as they should. With the third area of monitoring, you can then extend that feeling to the rest of the organization.
"Machine learning is such a black box". Open some doors to the box, and let other people in.